
Go back
Volkswagen | Vehicle Maintenance Data Platform
Designing an AI tool to provide data to customers and internal users improving their control and prediction over the condition of their vehicles.
Data Driven Solution
Problem Solving
User Experience
Retention
1. Problem and Opportunity
2. Exploring Solutions
3. Validating Solution
4. Production
5. Future Improvements
OVERVIEW
COMPANY
Volkswagen Digital Solutions
BUSINESS MODEL
Business-to-Business
YEAR
2020-2021
CONTEXT
MAN Truck & Bus company decides to proceed with the digitisation of the entire repair and maintenance process, in a unique ecosystem between fleet manager, workshops and drivers, focusing on fleet performances and cost reduction for commercial vehicles owners
Customer Problem
Unhappy with the lack of information about their vehicles maintenance status and trying to move to other brand services to fulfil their needs regarding the fleet maintenance.
The following factors are the reasons for the difficulties:
Missing information about the recommended timing to maintain vehicles
Time spent going to workshop appointments and waiting for specific parts when idle in the workshop
Lack vehicles issues visibility and predictibility
Without an offer in the market to check the complete fleet maintenance data
Results
A clear and easy-to-understand new User Interface: increase in session time and overall usage confirmed by Google Analytics
A simpler User Experience is validated via customer survey results and through customer feedback shared by the Sales team.
Increase of customers subscribing to the service: 1%-2% per week
Internal user from workshops is happier with the increase in customers and increase in maintenance demand.
More brand parts and components sold: the business second largest source of income
The Process
GOAL
Build a cross-platform ecosystem to solve current customer and internal user issues.
To have an offer of free service to use - included when purchasing new vehicles.
To lead to new and better habits when managing fleet maintenance.
To customise data and other preferences & everything that needs to be customised by customers.
To help retain their long-term loyalty - leading customers to buy again from the brand.

MY ROLE AND TEAM
I lead the project as a Product Designer teaming with a Service Designer from Munich.
After the business side validation, he left the initiative and everything continued along with:
1 Frontend team taking care of the Frontend core tasks
3 Backend teams periodically support Frontend tasks
Constant interaction with the Product Owners Weekly interactions with Sales team - which will take concepts to the customers - to validate ideas faster.
TOPIC RESEARCH
I researched the habits and behaviours of fleet managers and workshop users - visiting them on spot, learning about their workspace and interacting with the space and colleagues around but also absorbing knowledge from Sales colleagues.
I focused on how they track their fleet maintenance status and if they are using any app to help them.

Audience
TARGET USER AND MARKET SCOPE
User: People ageing between 30–50 years old that are not techies, have difficulties accepting new work processes or interacting with unclear actions and are not email fans. Also, have visual limitations.
Market: Major and minor fleet managers from all European countries.
Preference for customers that owns brand vehicles.
Insights
Costs of vehicles stopped due to maintenance problems go up to hundreds of euros per day.
The quantity of downtime of the brand trucks is increasing due to a lack of proactivity maintenance.
Fleets can have more than 1000 vehicles.
Fleet managers are only 20% of the time using the desktop.
Competition services do not have access to the brand truck data.
Some fleets have their own workshops to fix their vehicle's problems.
USER INTERVIEWS
I conducted initial field research selecting our testing user in order to cover:
Both large and small fleet managers as the users;
Six different countries and cultures
Fleet maintained by brand workshops and by themselves
An end survey was sent to give the opportunity to users to give us any further feedback on something they forgot or missed.

INTERVIEW KEY FINDINGS

Key Quotes directly from the user
“I want to take care of all the maintenance by myself!”
‘’I need to see everything, at a glance! Just that.’’
‘’I wish I could learn about vehicle issues before my drivers.’’
‘’I spend too much time trying to understand what is wrong with a vehicle.’’
‘’Maintenance management is a major issue in this business.’’
’’It’s time to have all my fleet data on a screen.’’
Pain Points
EMPATHY MAP
After our interview, together with the POs I mapped the response and thought of the user to understand their environment and emotional connection.

Pain Points

Design Principles
After the research and user interviews, I have come up with a set of design principles to admit while designing - maintaining the relationship between the research output and our platform predefined UI design system:
Ideation + Validation
I come up with concepts to solve the problems for the initial phase.
The first ideas were presented and discussed with:
Product Owners
Business approach validation and alignment with after-sales team plus alignment with the product vision.
Developers
As product team, everyone was interested to share inputs about how we are solving real problems. It's not about technical inputs.
AfterSales
The first point of contact of customers they have unlimited inputs to share and are the fastest way to validate or find what is missing.

Solution Documentation
SOLUTION OVERVIEW
After validation I needed to document the different user experiences and interactions between the intermediates of the complete experience:
Helpful to identify and validate each contact point and bring technical discussions to the table allowing us to predict dependencies or even irrealistic approaches.
Due to the complexity of some features and the many different pathways a user can take when interacting with the product I needed to document them in this way to make clear all possibilities of actions from the user using the feature.


WIREFRAMING ROUNDS
I made a visual storyboard to study how fleet managers will explore our features and what are all the circumstances they use in this app.
Starting with low-fi and going from there to high fidelity - some features didn’t need the Low-Fi process validation.

Design Alignments
The development team and Product Owner will gather twice a week to have an exclusive UX-oriented meeting where I bring the pending topic to the table to discuss topics and validate approaches.
Every user experience is shared and discussed using the prototyping tool Invision, allowing to share of ongoing material with Sales and other business-oriented colleagues, speeding up feedback from their side.
ABOUT THE DESIGN SYSTEM
Considering that the next phase is to design High Fidelity concepts to be later delivered to the team it’s important to mention that all User Interface design was designed according the RIO platform Design System rules and good practices.
Eventually, new components were needed in order to deliver the best possible way for users to interact with the service - when this occurred I directly contacted the UI Kit colleagues to align the needs and expectations to share with the POs and development team regarding when and if it would be possible to deliver what we needed.
Testing Multiple Version for Better Convertion
A/B TESTINGS
Some features requested extra inputs from stakeholders or end users, in order to gather direct and valuable inputs to confirm our assumptions and answer our doubts. To achieve that we prepared regularly visual concepts to apply A/B tests, check below some examples:
Customer Overview Area
Option A - Overall KPIS + Large Chart

Option B - Detailed KPIS + Minor Charts

Brake Lining Table Detail View
Option A - Overall KPIS + Large Chart
Option B - Detailed KPIS + Minor Charts
Core Feature
RESULT
Allow users to define what should be delivered to workshops to be maintained or what to maintain by itself.
After some interactions and brainstorming sessions with the Product Owner, we come up with two modes of proactive service that allows users to adapt the experience to their real needs.
Proactive mode:
Accepting to release the vehicle data to workshop allows customers to:
• Have partner workshops analysing the fleet maintenance status
• Be proactively contacted by workshop users about issues
• Have appointments automatically scheduled
Manual mode:
When disabling the proactive maintenance feature, the customer experience will adapt to the selected preferences:
•Vehicle data is hidden from ALL external workshops
•Vehicle data is displayed in full detail for self analysis
•User need to manually schedule own appointments

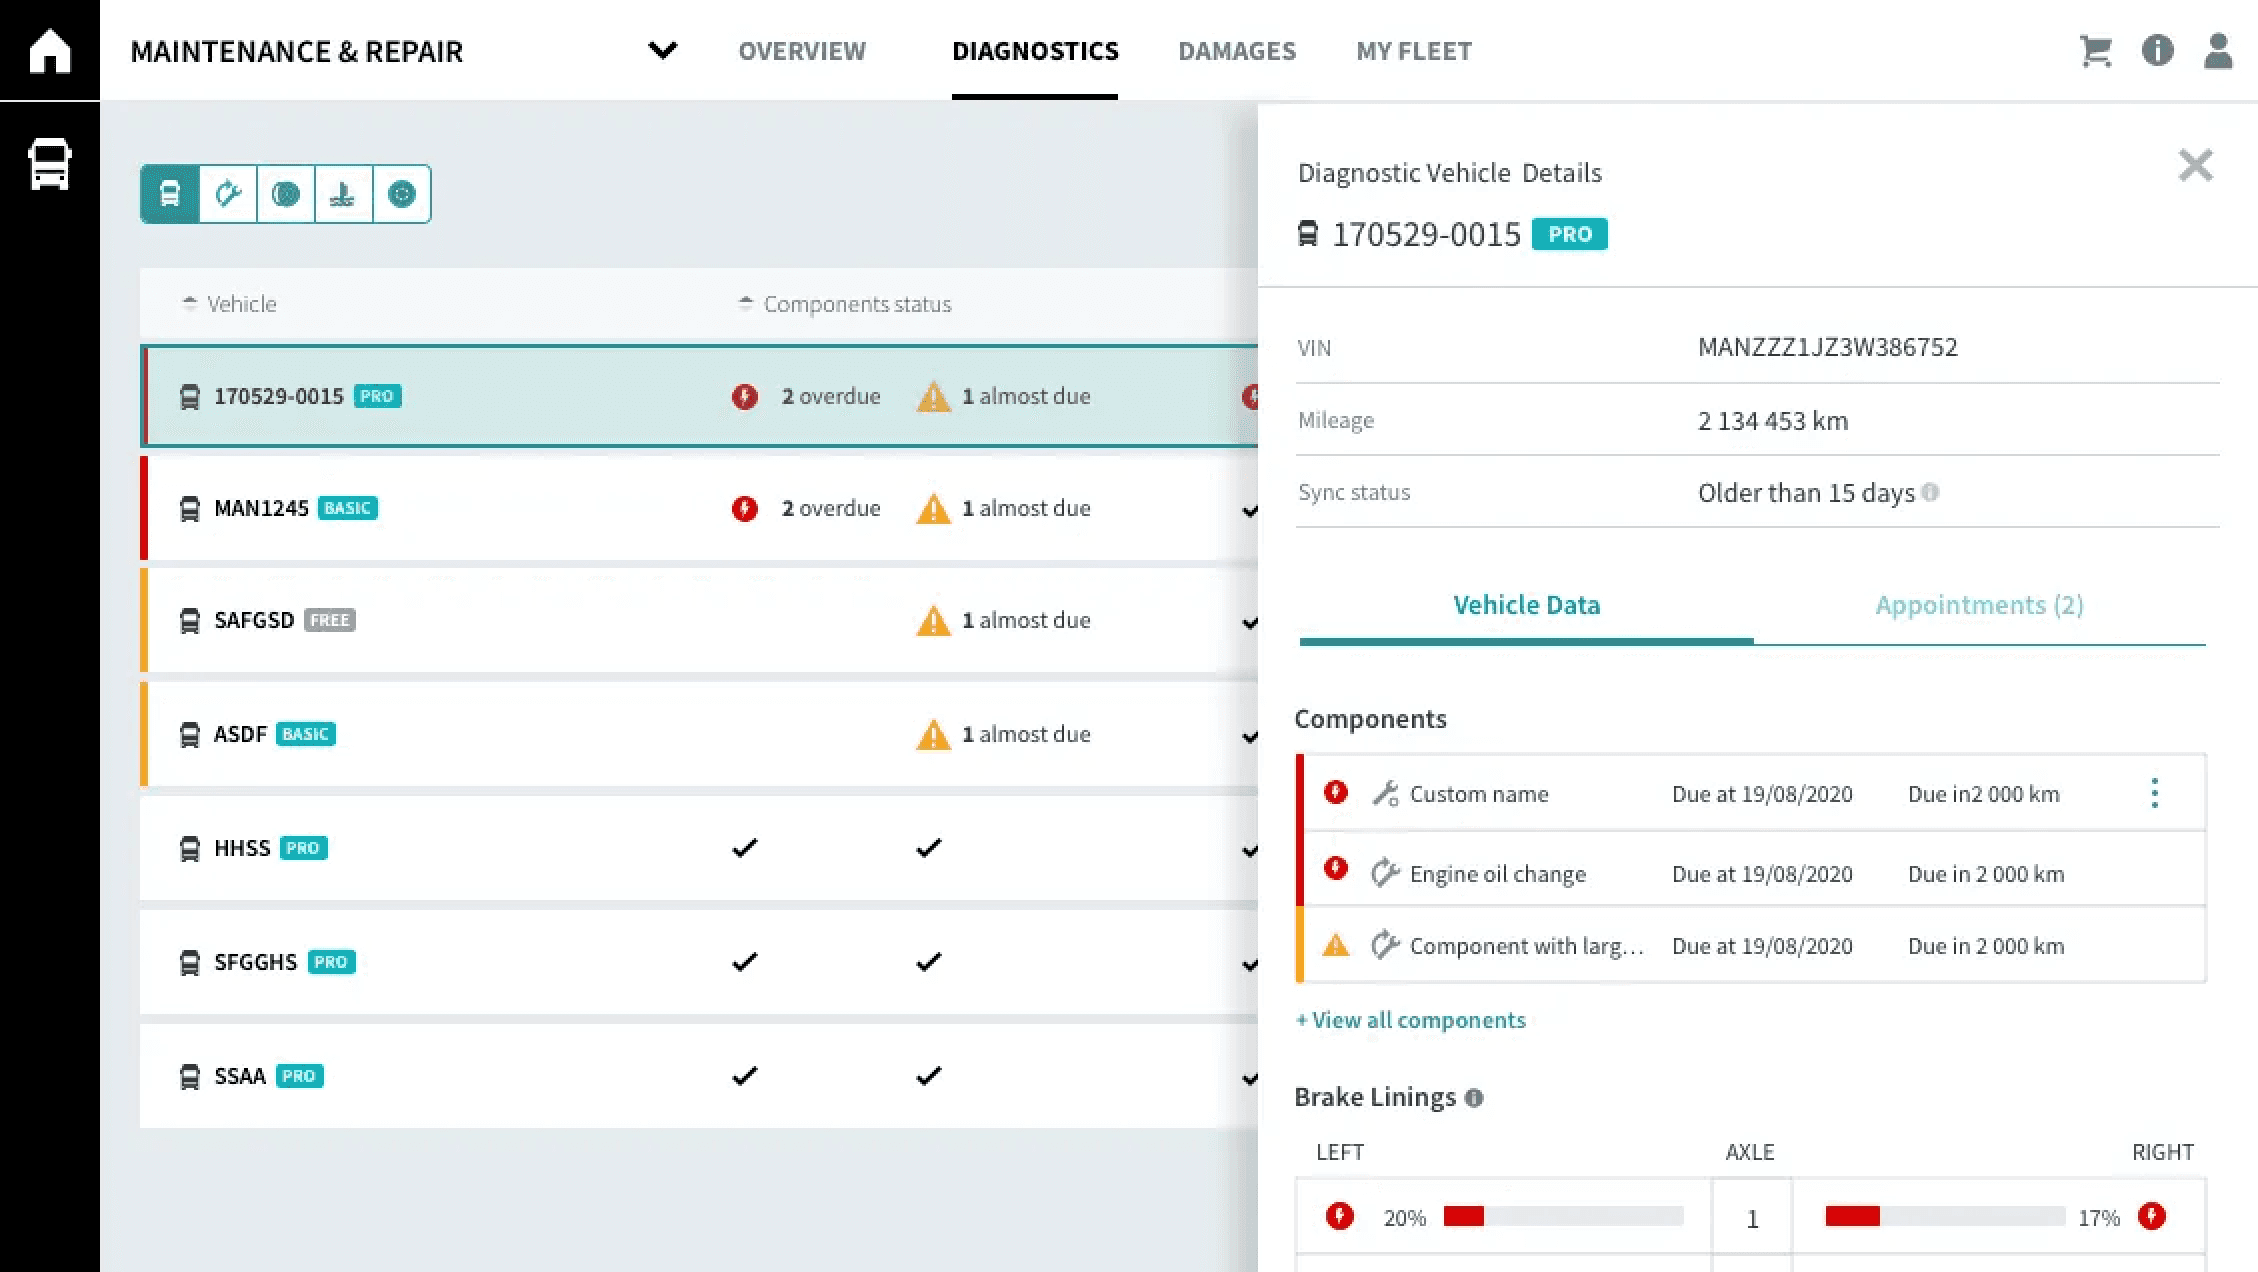
OTHER UI FEATURES
Predictive Brake lining maintenance Cross-Users (Fleet Manager + Workshop User)
Fleet Manager Visual (Customer App)

Workshop User Visual (Internal App)

Note: To comply with a NDA, sensitive information about the software was hidden in this case study. The information shown here is my own and does not reflect the views of the company.
Next Use Case: Sportek | NFTs Auctions & Marketplace